
What are Bolts?
In the world of baseball, a “bolt” is defined as a sprint that exceeds a speed of 30 feet per second (ft/s) in a one-second window, which translates to roughly 20.5 mph. This impressive pace is typically achieved by elite baserunners in the MLB. There’s an intriguing chart detailing baserunner sprint speed showing player speeds categorized by position. On average, players across the league clock in at 27 ft/s. Notably, the fastest players on the field tend to be shortstops and centerfielders, while designated hitters (DHs), catchers, and first basemen usually trail behind. This speed distribution aligns with conventional baseball wisdom. For players without metrics, a model to predict sprint speed has been created.
MLB employs advanced player tracking technology to capture these speeds. The chosen metric is the peak speed during a one-second window either during multi-base hits (home runs excluded) or during sprints to first on topped balls. But what about high school players? Assessing their “bolt” capacity can be a challenge unless they’re equipped with a GPS device, such as a Titan. To provide some perspective, I’ve formulated an estimate using a 50-yard span between the 10-yard mark and the 60-yard endpoint. This could be called a flying 50 or a 10 into 50. While this method offers a broader view rather than a pinpointed number, it still gives us a general idea or a “ballpark” figure.
Analyzing the Bolts Data
Drawing from data at a national showcase (please refer to the previous post on baseball speed for an in-depth discussion on the methodology, and remember, this data doesn’t represent the average high school athlete), elite young runners begin to clock in bolts around the age of 15. The frequency of bolts sees a marked increase once a player turns 17.
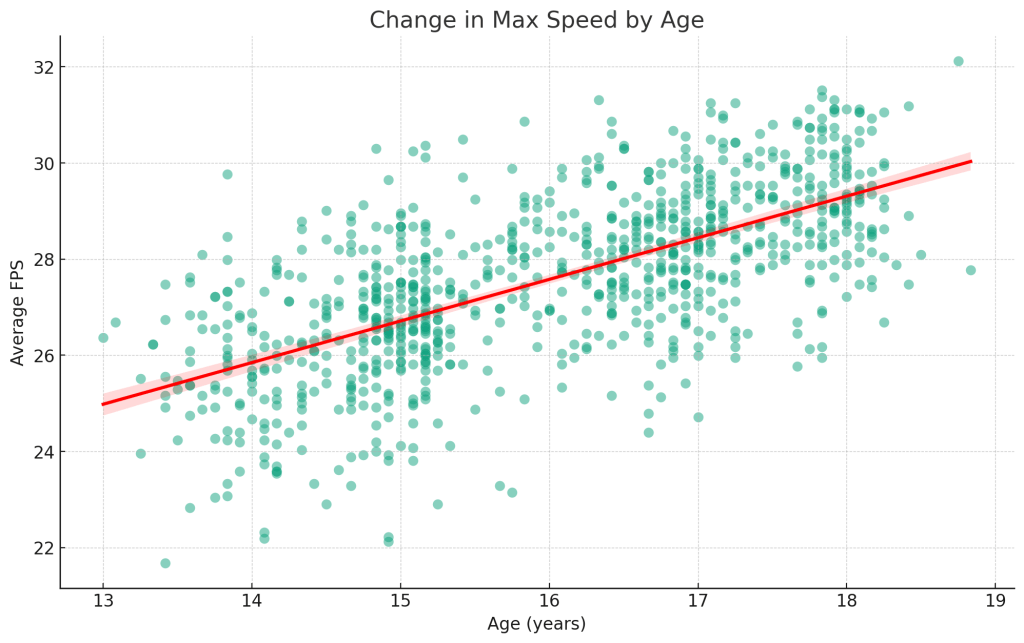
A regression analysis indicates that the average elite players typically gain a maximum speed of 0.85 ft/s, or approximately 0.6 mph, for every year of growth. I don’t have pairwise data to see what the same player runs at young age and then an older age, so take this as an estimate. Someone who’s already running over 30 fps at age 15 won’t see that level of gain every year. On the flip side, the slower kids at ages 13 though 16 either get faster or opt out of the sport (or at least opt out of the showcase test) because there’s no one who ran under 24 fps after age 16.
This wraps up the series on overall speed (60 yard times), acceleration (10 yard times) and now max speed (bolts). Hopefully you now have a comprehensive view of speed in high school baseball.

One thought on “Top Sprint Speed in High School Baseball: Bolts”